Monitoring
You can monitor your local or cloud-hosted OWASP Juice Shop instance using internally gathered metrics and visualize those on dashboards.

Prometheus Metrics
Juice Shop collects functional and technical metrics using a Prometheus client module. Its endpoint is publicly accessible and there is even a challenge asking you to "Find the endpoint that serves usage data to be scraped by a popular monitoring system".
To consume these metrics you need to set up a Prometheus server which is very straightforward:
- Install Prometheus on the machine that will monitor your Juice Shop instance
- Configure your Juice Shop instance as a scraping target in the
prometheus.yml. A simple config example you can find below. - Start your Prometheus server which by default runs on http://localhost:9090
- Check if your scraping endpoint shows "UP" as its state at http://localhost:9090/targets
scrape_configs:
  - job_name: 'juiceshop_local'
    scrape_interval: 30s
    scrape_timeout: 10s
    static_configs:
    - targets: ['localhost:3000']
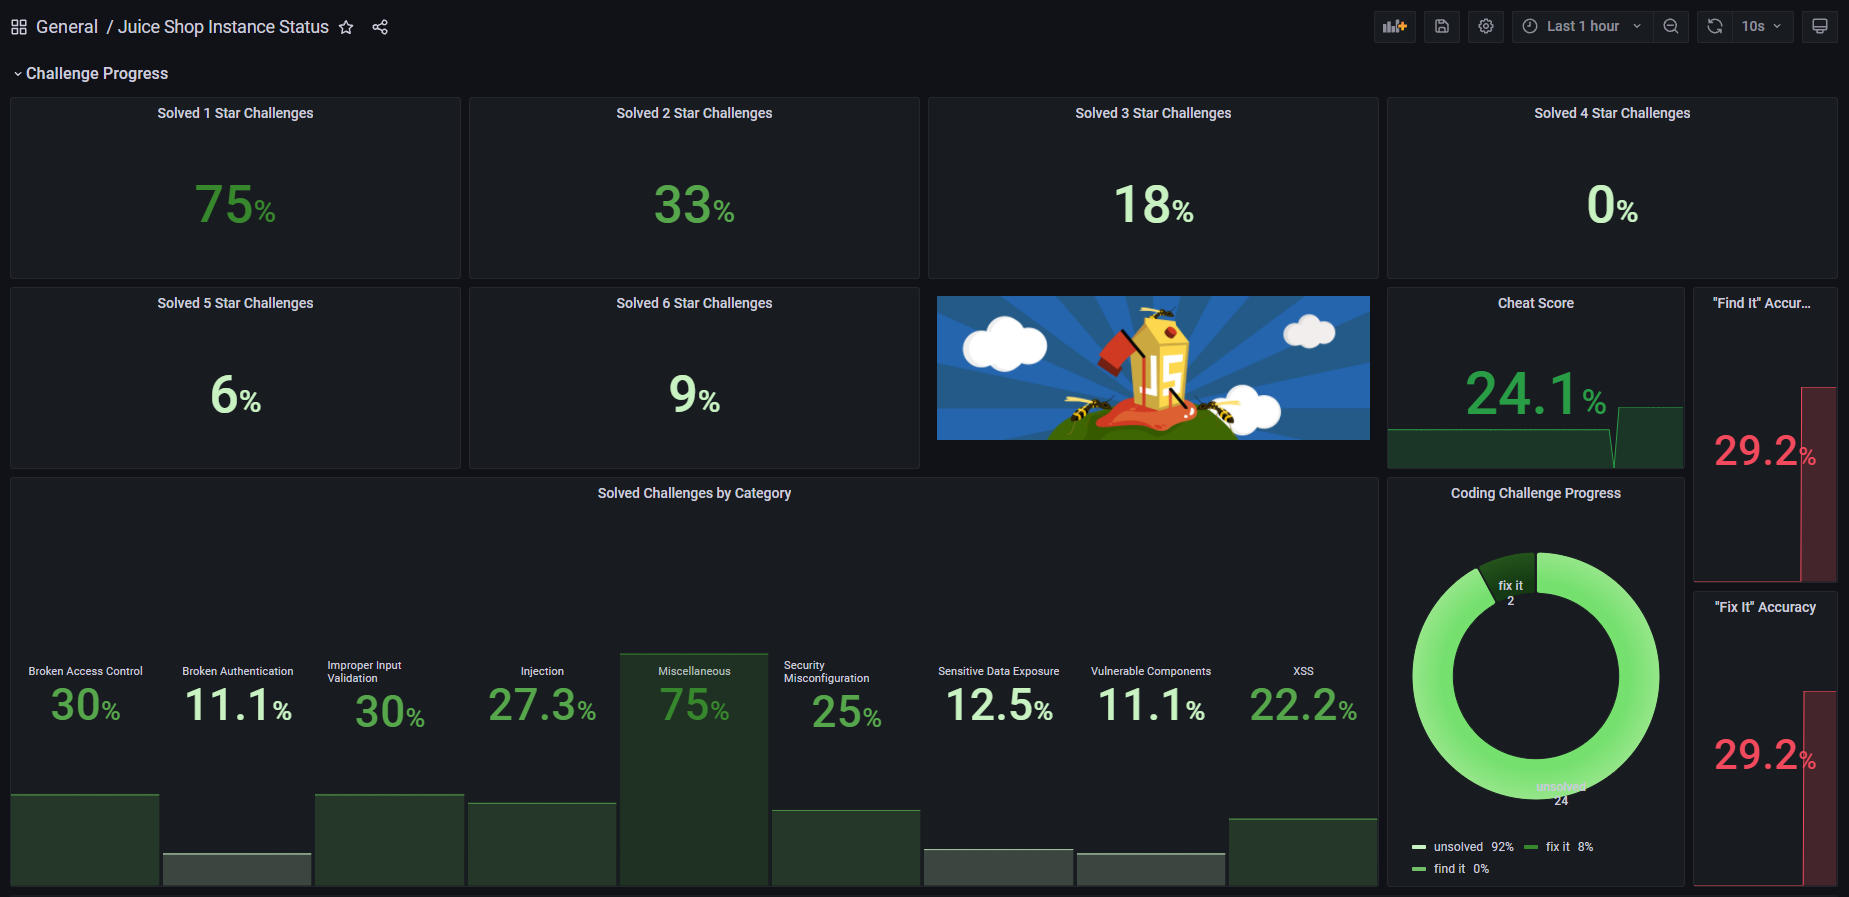
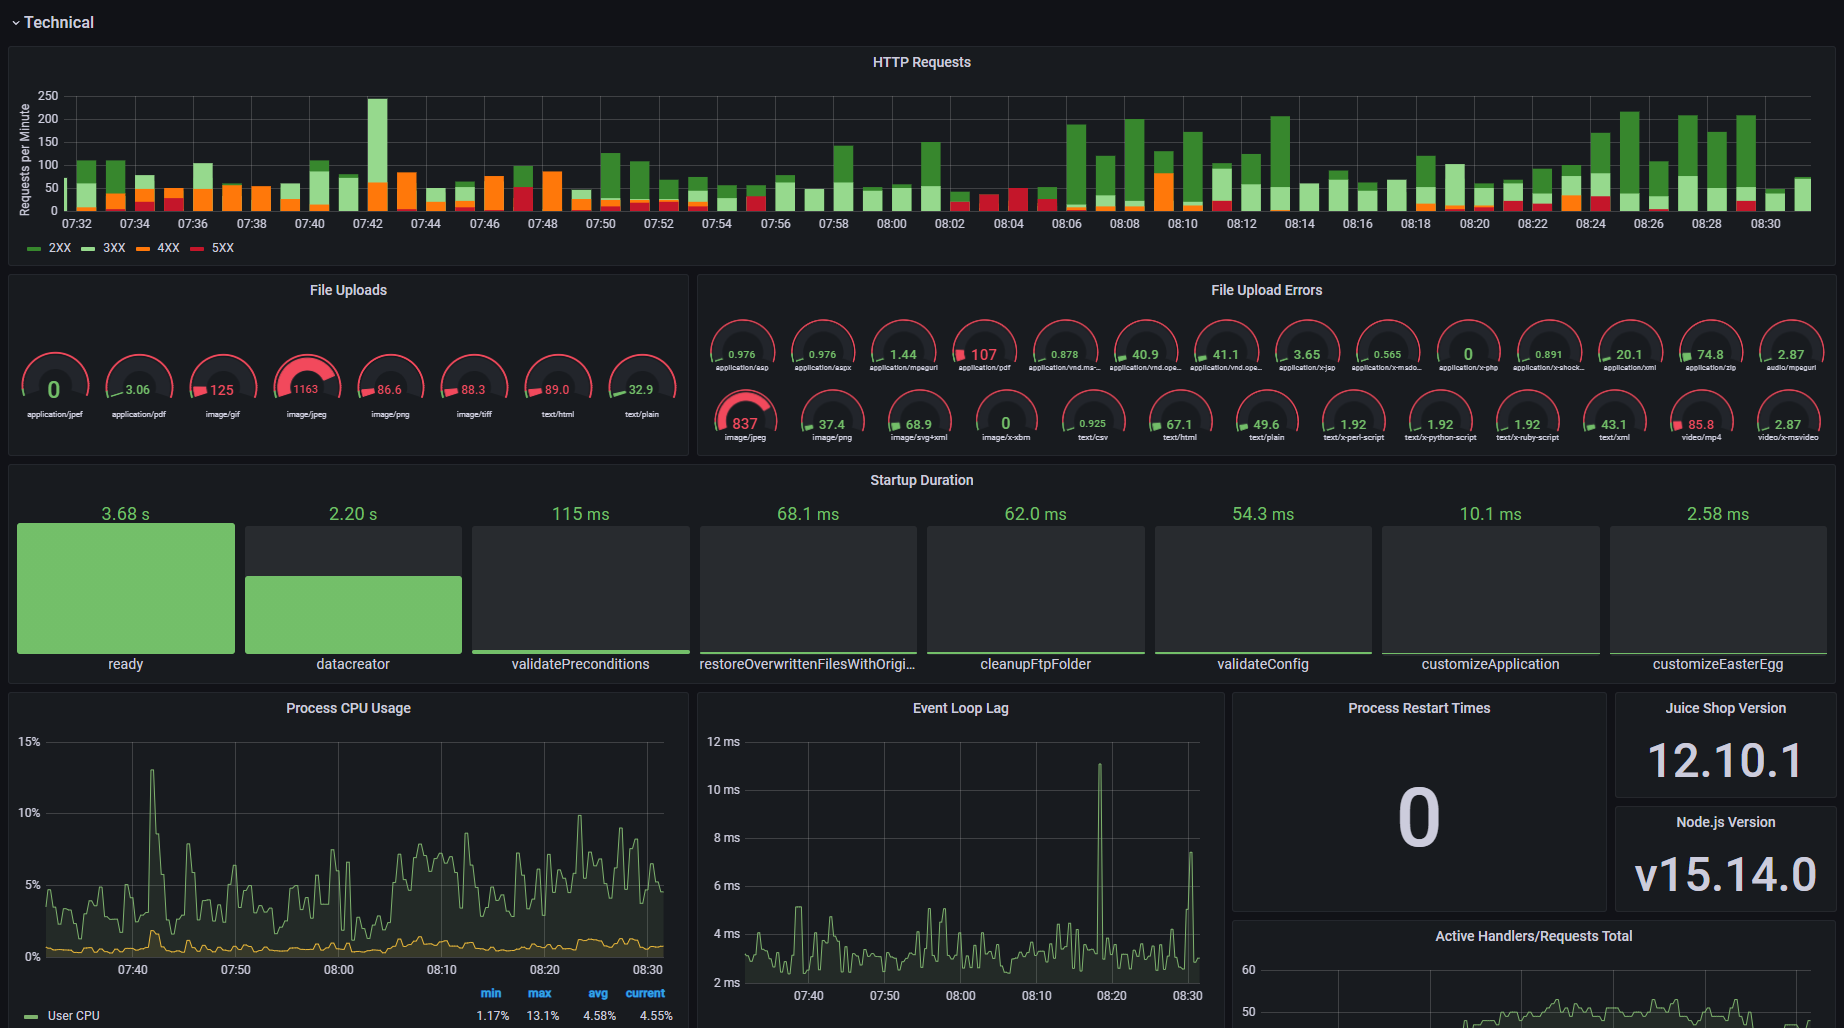
You can create dashboards and alert rules in Prometheus itself, but if you want to have a fancy dashboard like the one in the screenshots above, you need a bit more visualization firepower.
Grafana Dashboard
This is where Grafana comes in. Juice Shop comes
with a full-fledged JSON template that you can import as a new
dashboard into your own Grafana installation. It consumes and displays
all metrics gathered via Prometheus as seen in the screenshots above.
- Install Grafana (for ease-of-use, best use the machine you also have Prometheus running on)
- Start Grafana and visit it at http://localhost:3000 (ℹ️ Its default port is the same as Juice Shop's, so if you run both on the same machine, one needs to be moved to a different port.)
- Log in with
admin/admin. - Go to Configuration > Data Sources at http://localhost:3000/datasourcesand click Add data source
- Select Prometheus and in its configuration screen set http://localhost:9090 as the HTTP > URL. Clicking Save & Test will confirm if Grafana could find your Prometheus server.
- Now go to Dashboards > Manage at http://localhost:3000/dashboards
- Click Import and either upload or paste the contents of the
monitoring/grafana-dashboard.jsonfound in the Juice Shop's GitHub repository. - Now visit the imported Juice Shop Instance Dashboard by clicking on its name to view it! Voilá!
ℹ️ The "Juice Shop Instance Dashboard" template was forked from the multi-instance dashboard of MultiJuicer, so if you need to run and subsequently monitor multiple Juice Shop instances, best take a look at MultiJuicer and our Trainer's guide.